How Can Live Data Presentation Fit Within the Enterprise Data Pipeline?
Every organization runs some version of the same data pipeline. Five steps, each one supposedly handing off cleanly to the next. But there's a gap between steps four and five that's costing enterprises millions in misunderstood data, bad decisions, and lost attention spans.
By Jason Marsh, CEO & Founder, Flow Immersive
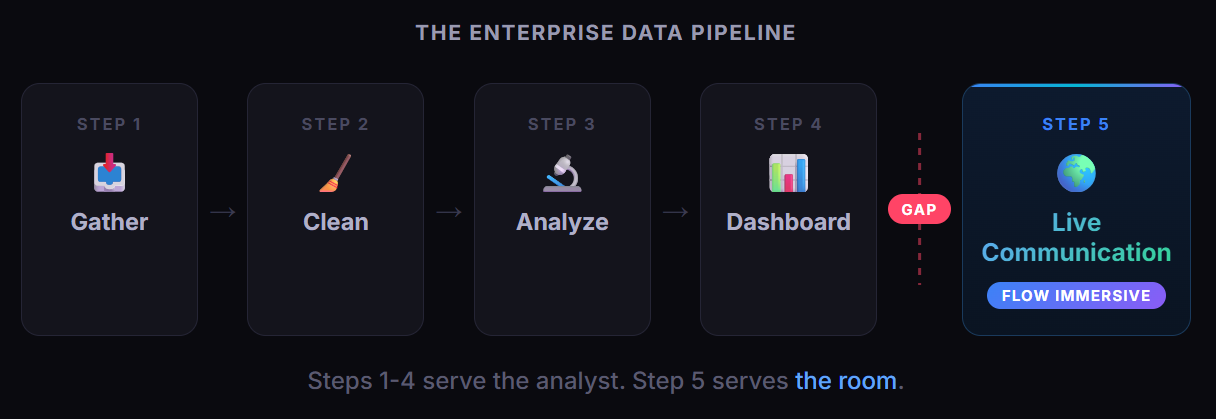
Most organizations run a four-step data pipeline: gather, clean, analyze, and dashboard. But there is a critical fifth step that almost no one has tooling for: live data communication. This is the moment when data stops serving the analyst and starts serving the room.
What Are the Five Steps of an Enterprise Data Pipeline?
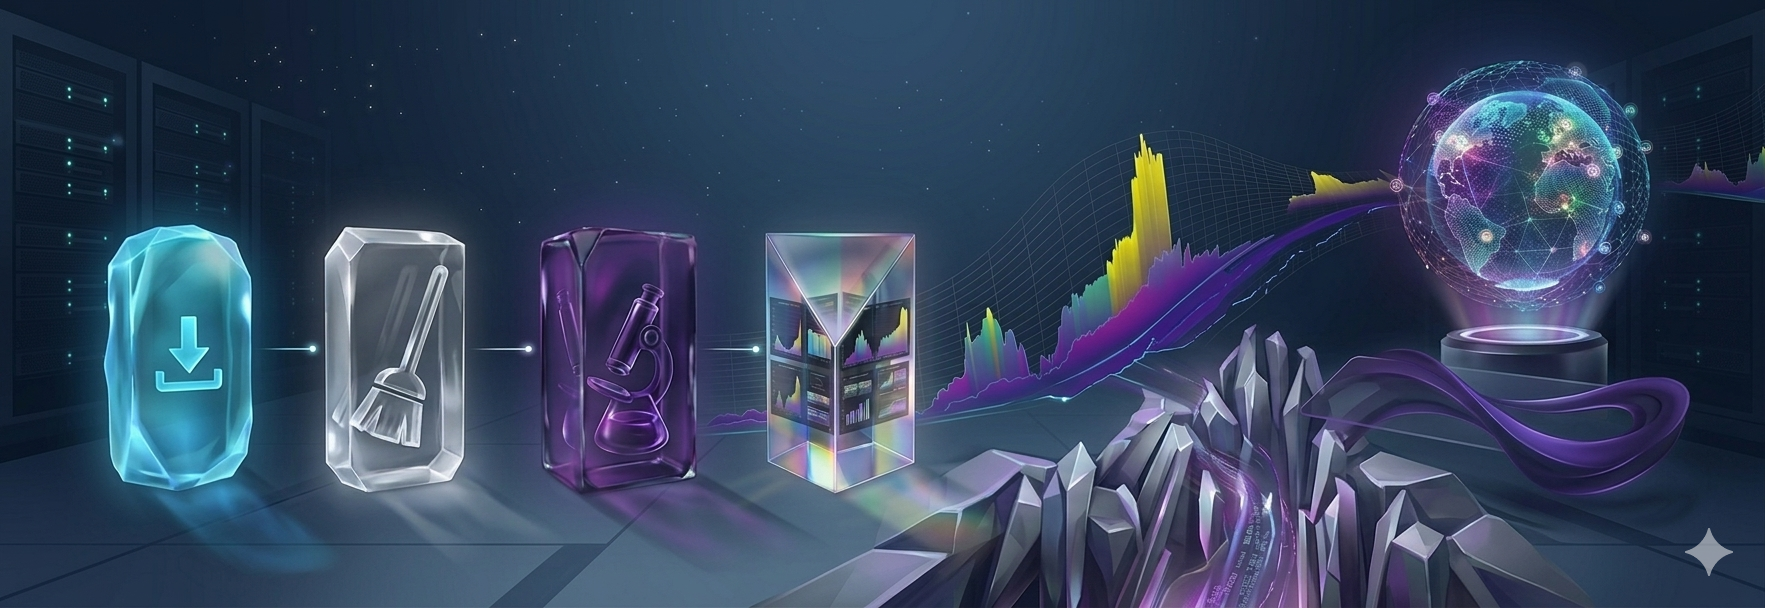
Every data-driven organization follows a similar progression from raw data to decisions. Here are the five steps:
Step 1: Data Gathering Collecting raw data from APIs, IoT sensors, manual entry, and third-party feeds. Data arrives unstructured and messy.
Step 2: Data Cleaning Merging, deduplicating, handling outliers, and normalizing formats. Data engineers prepare the dataset before anyone else touches it.
Step 3: Data Analysis Data scientists write Python, run SQL queries, and build statistical models. The goal here is personal comprehension. One person needs to understand what the data means.
Step 4: Dashboarding Teams create charts and visualizations in tools like Tableau, Power BI, or Excel. The assumption is that stakeholders will open these dashboards and use them regularly.
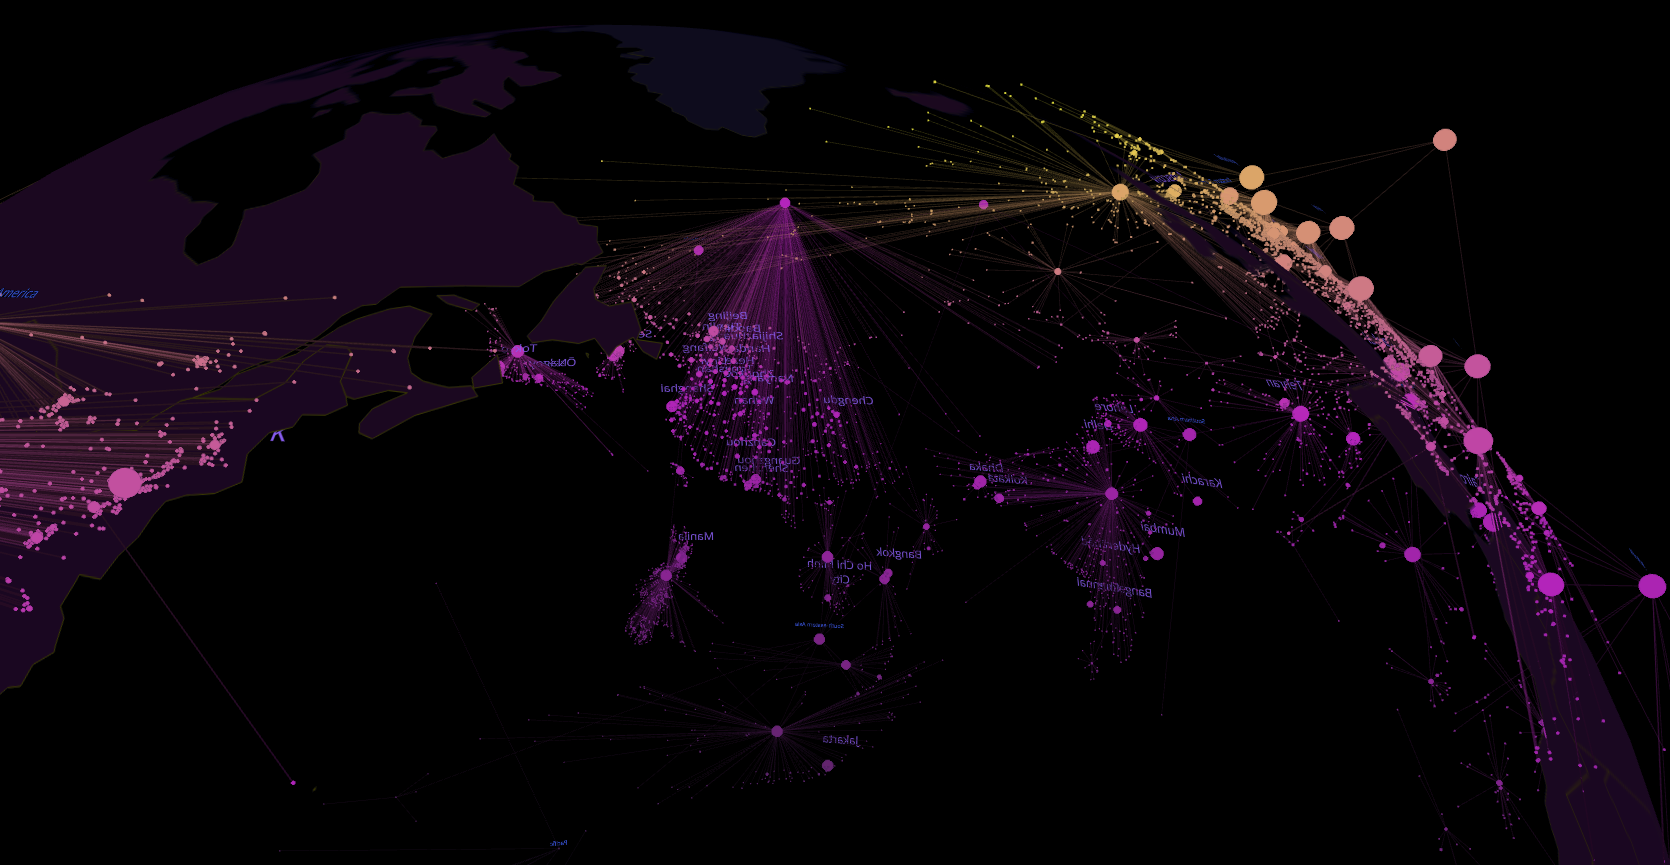
Step 5: Live Data Communication Real-time data conversations in meetings where data is spatially present, queriable by voice, and structured as a narrative. This is where decisions actually happen because the entire room builds shared understanding together.
Why Is There a Gap Between Dashboards and Decisions?
Dashboards are built for self-service consumption. But stakeholders rarely use them that way. What actually happens is predictable and wasteful: presenters copy and paste screenshots of their Tableau or Excel charts into PowerPoint slides.
The result is static, boring, and actually difficult for the brain to focus and remember. A wealth manager at Morgan Stanley described the result: "After the 4th slide, I've lost their attention."
The entire investment in data infrastructure collapses into static images inside slide decks. The interactivity disappears. The context vanishes. And the audience checks out.
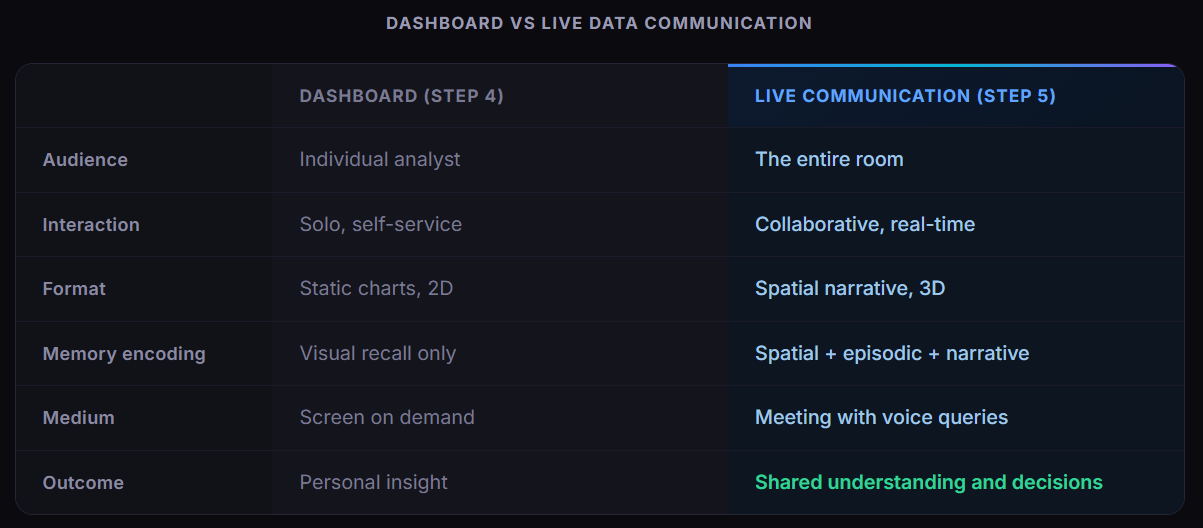
What Is the Difference Between a Dashboard and Live Data Communication?
A dashboard is reference material. It sits on a server waiting for someone to open it. Live data communication is a shared spatial experience, designed for meetings where multiple people need to reach understanding simultaneously.
The distinction maps to how human memory actually works. The hippocampus encodes spatial memory and episodic narrative through the same neural structures. We remember where things are and stories that unfold over time far better than we remember bullet points on a slide. Flow is built on that neuroscience foundation.
How Does AI Change the Data Pipeline?
AI now compresses all five pipeline steps into a single workflow. The Flow Spatial Cognitive Platform can take raw data and handle the gathering, cleaning, analysis, visualization, and narrative construction through natural language commands.
Users ask questions in plain English. The AI writes Python to process the dataset, identifies the story worth telling, and constructs a 3D narrative you can walk a room through in real time. Different team members enter at whichever step matches their role.
A data scientist might start at Step 3 with pre-cleaned data. A CEO might upload a CSV and ask "what should I notice about this?" and enter at Step 1. The platform meets them where they are.
Why Does This Matter Now?
Three shifts are converging:
- Smart glasses are shipping. Over 30 million smart glasses are projected to ship by 2027, making spatial data experiences accessible at scale.
- AI assistants are becoming the default data interface. When users ask Claude, ChatGPT, or Gemini to visualize data, the output needs a spatial layer.
- The meeting is the moment of truth. Remote and hybrid work means data must travel across devices, and static slides cannot carry that weight.
The spatial intelligence layer between AI and human comprehension is the next platform shift.
The Core Insight
Every tool in your data pipeline serves the analyst. Gathering tools serve the engineer. Cleaning tools serve the engineer. Analysis tools serve the data scientist. Dashboards serve the data scientist.
Step 5 serves the room: management and the team.
Frequently Asked Questions
What is the data coummunication pipeline in simple terms?
A data pipeline is the sequence of steps organizations follow to turn raw information into decisions. The five steps are: gather data, clean it, analyze it, visualize it in dashboards, and communicate it live in meetings. Most organizations stop at step four and lose the value at the point of decision.
Why do dashboards fail to drive decisions?
Dashboards fail because they are designed for individual self-service exploration, but decisions happen in rooms with multiple people. Data scientists end up screenshotting dashboard charts into PowerPoint slides, collapsing interactive visualizations into static images that lose their audience quickly.
What is live data communication?
Live data communication is the practice of presenting data as a real-time, interactive spatial experience during meetings. Participants can query the data by voice, filter collaboratively, and walk through a narrative together. This contrasts with static presentations where one person shows slides.
What is a Spatial Cognitive Platform?
The Flow Spatial Cognitive Platform (SCP) is a system that uses AI and spatial computing to transform datasets into 3D narrative experiences. It compresses the entire data pipeline into a single workflow where users can ask questions in natural language and receive interactive visualizations designed for group understanding.
How does spatial data visualization improve retention?
The human hippocampus encodes spatial memory and episodic narrative through the same neural structures. People remember spatial relationships and stories significantly better than flat text or 2D charts. Spatial data visualization leverages this biological advantage to make data memorable.
What devices support spatial data experiences?
Spatial data experiences work across browsers (any device), smartphones, and smart glasses including XREAL Air 2 Ultra, XREAL One Pro, and WebXR-compatible devices. The same visualization adapts to whatever screen the user is holding.
Flow Immersive transforms datasets into spatial experiences for live data communication. Learn more at flowimmersive.com.